TN AppSvr298 How to Create an ArchestrA Graphic to Monitor System Platform Engine Health
![]()
How to create an ArchestrA graphic to monitor System Platform Engine Health
This Tech Note walks you through how to create an overview of your Engine Health graphically.
- Author: Alex Davenport
- Published: 03/19/2018
- Applies to: Application Server
1 Open up the IDE and navigate to the Engine you wish to show data from.
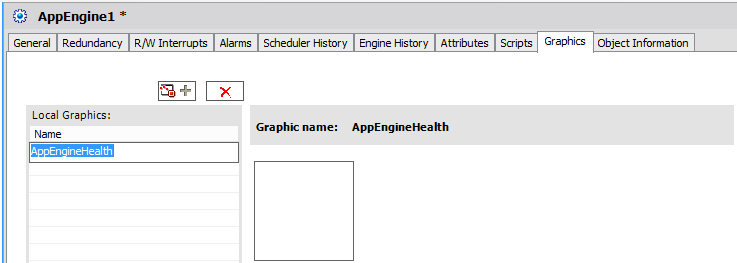
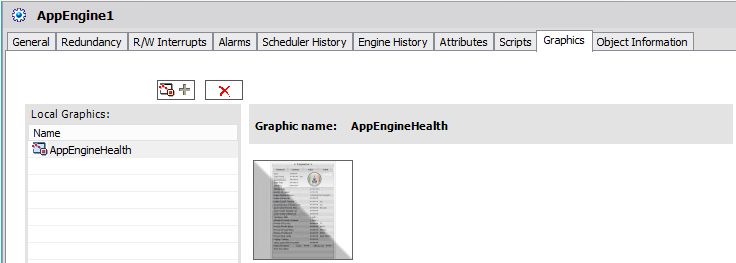
2 Double click the Engine to open up the Object Editor. Click on the Graphics Tab, and then the Add Graphic Button. Name your graphic, which in this example it is called AppEngineHealth; then double click to open the Graphic Editor.
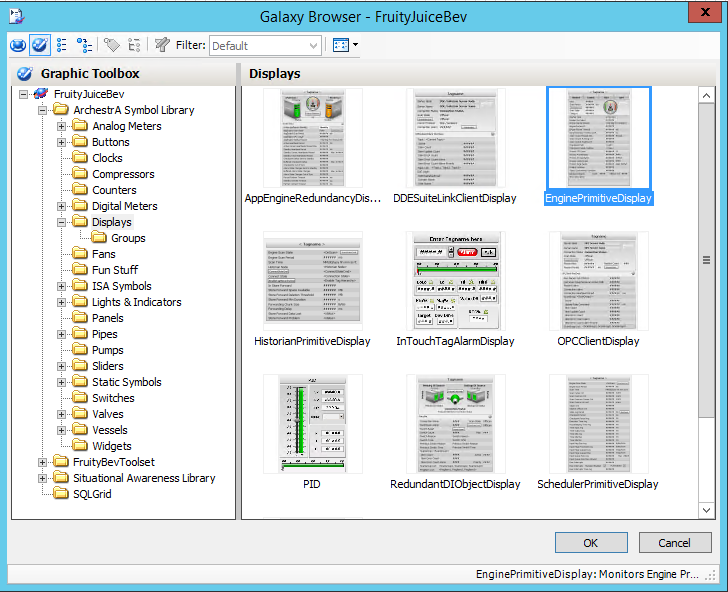
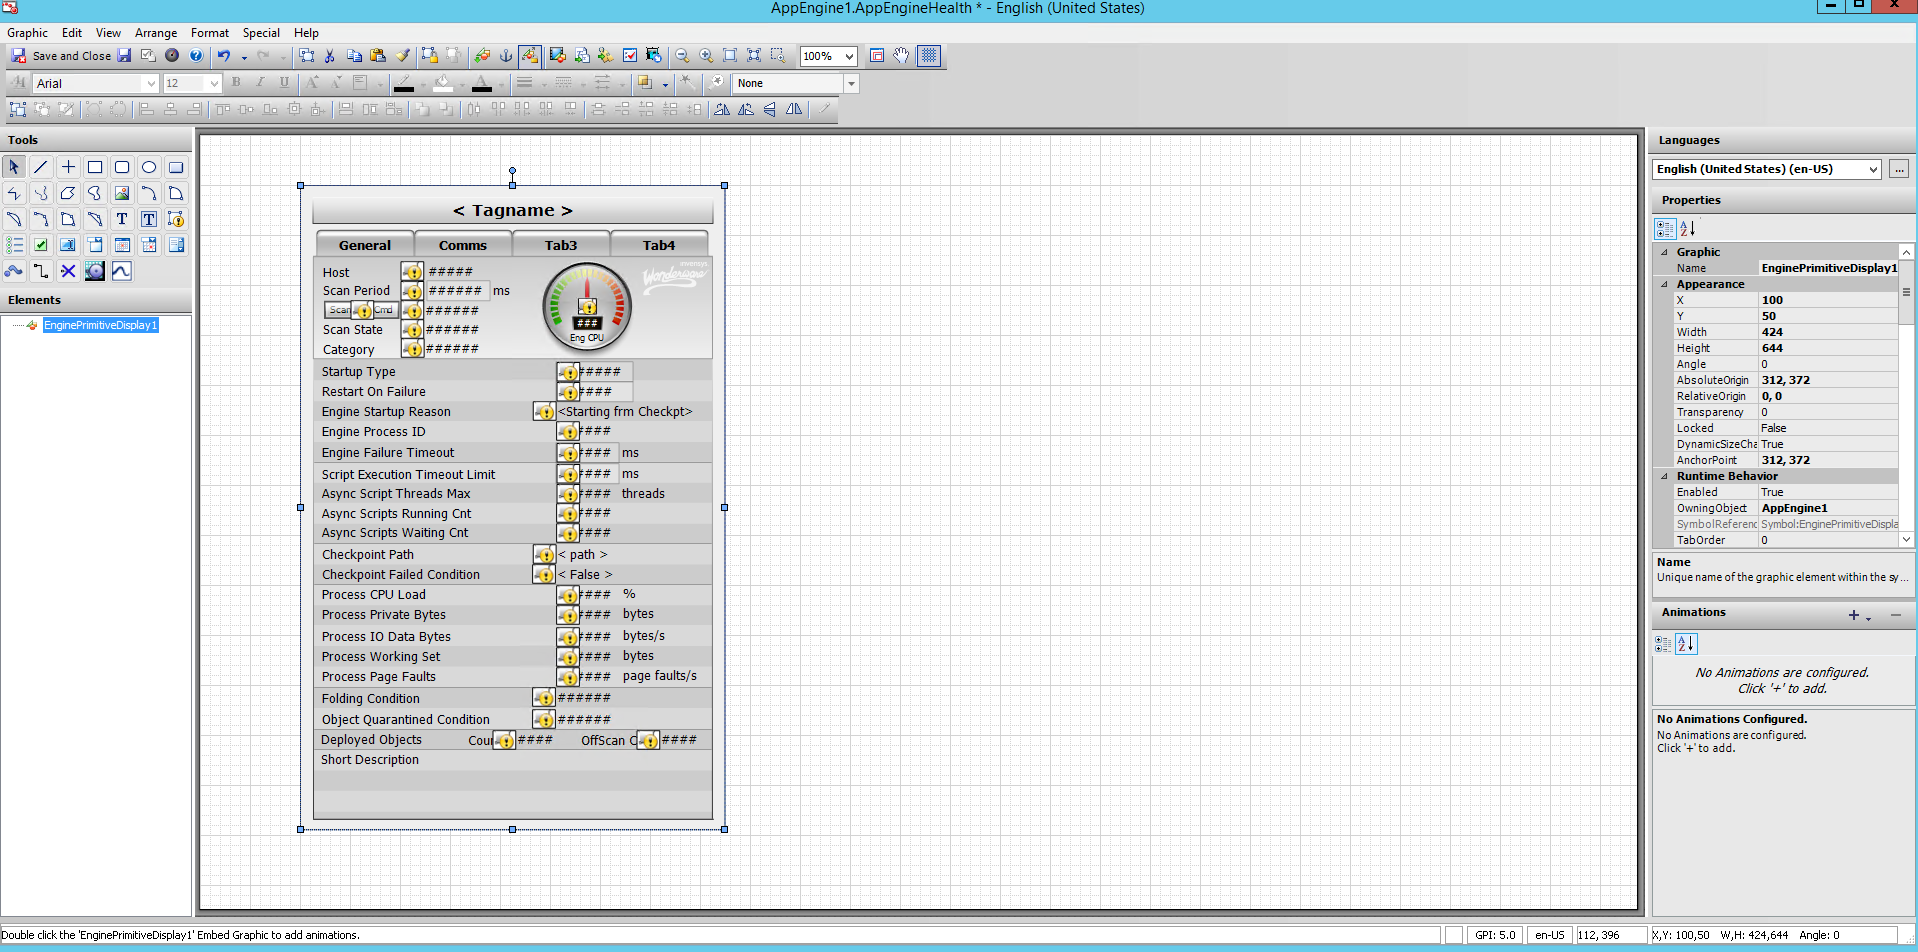
3 Browse to ArchestrA Symbol Library / Displays; then select the EnginePrimitiveDisplay graphic; then embed it into your graphic.
4 Once embeded into your graphic, click on the Save and Close Button.
5 Your ArchestrA graphic is now showing on your Engine Object.
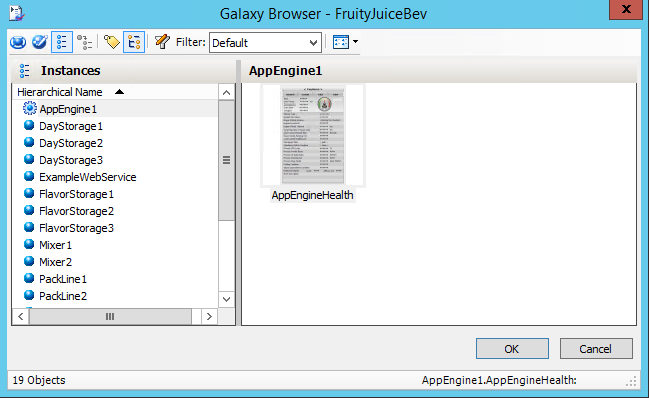
6 Open InTouch WindowMaker and create a System Health window. Click the Embed ArchestrA graphic button, and select Instances in the Browser. Navigate to the Engine you created a graphic on and click the OK button.
7 The ArchestrA graphic will now be in the InTouch window you previously created as seen below.
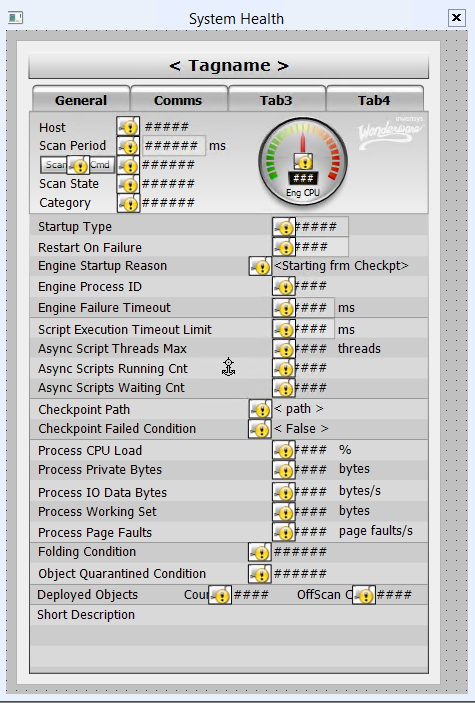
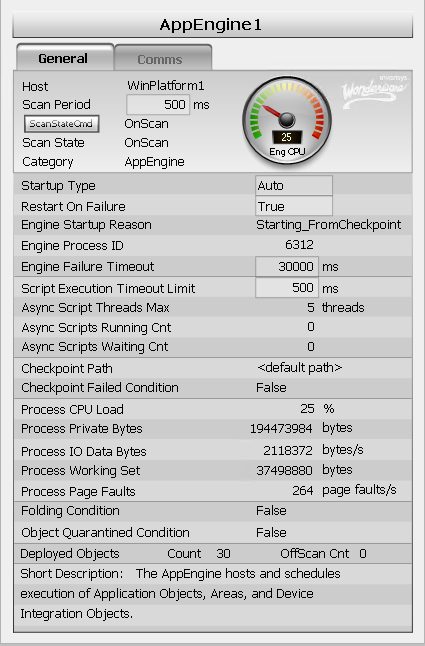
8 Click on Runtime and you will now see your graphic populate with the information associated to the Engine.