TN - 1025 Visualizing Plant Data with Insight Assets
Description
This article from InSource shows how to group plant assets into a well defined hierarchy and view content in "asset centric" visualizations.
- Author: Chris Selph
- Published: 9/15/2020
- Applies to: Insight
Overview
AVEVA's Insight platform provides several visualization options for Historical and Asset Performance data in your plant. You can use "tag centric" content views like Trends and Status Boards each of which can be viewed independent. You can also view content related to an asset via an "asset centric" interface called simply "Assets".
Asset View Example
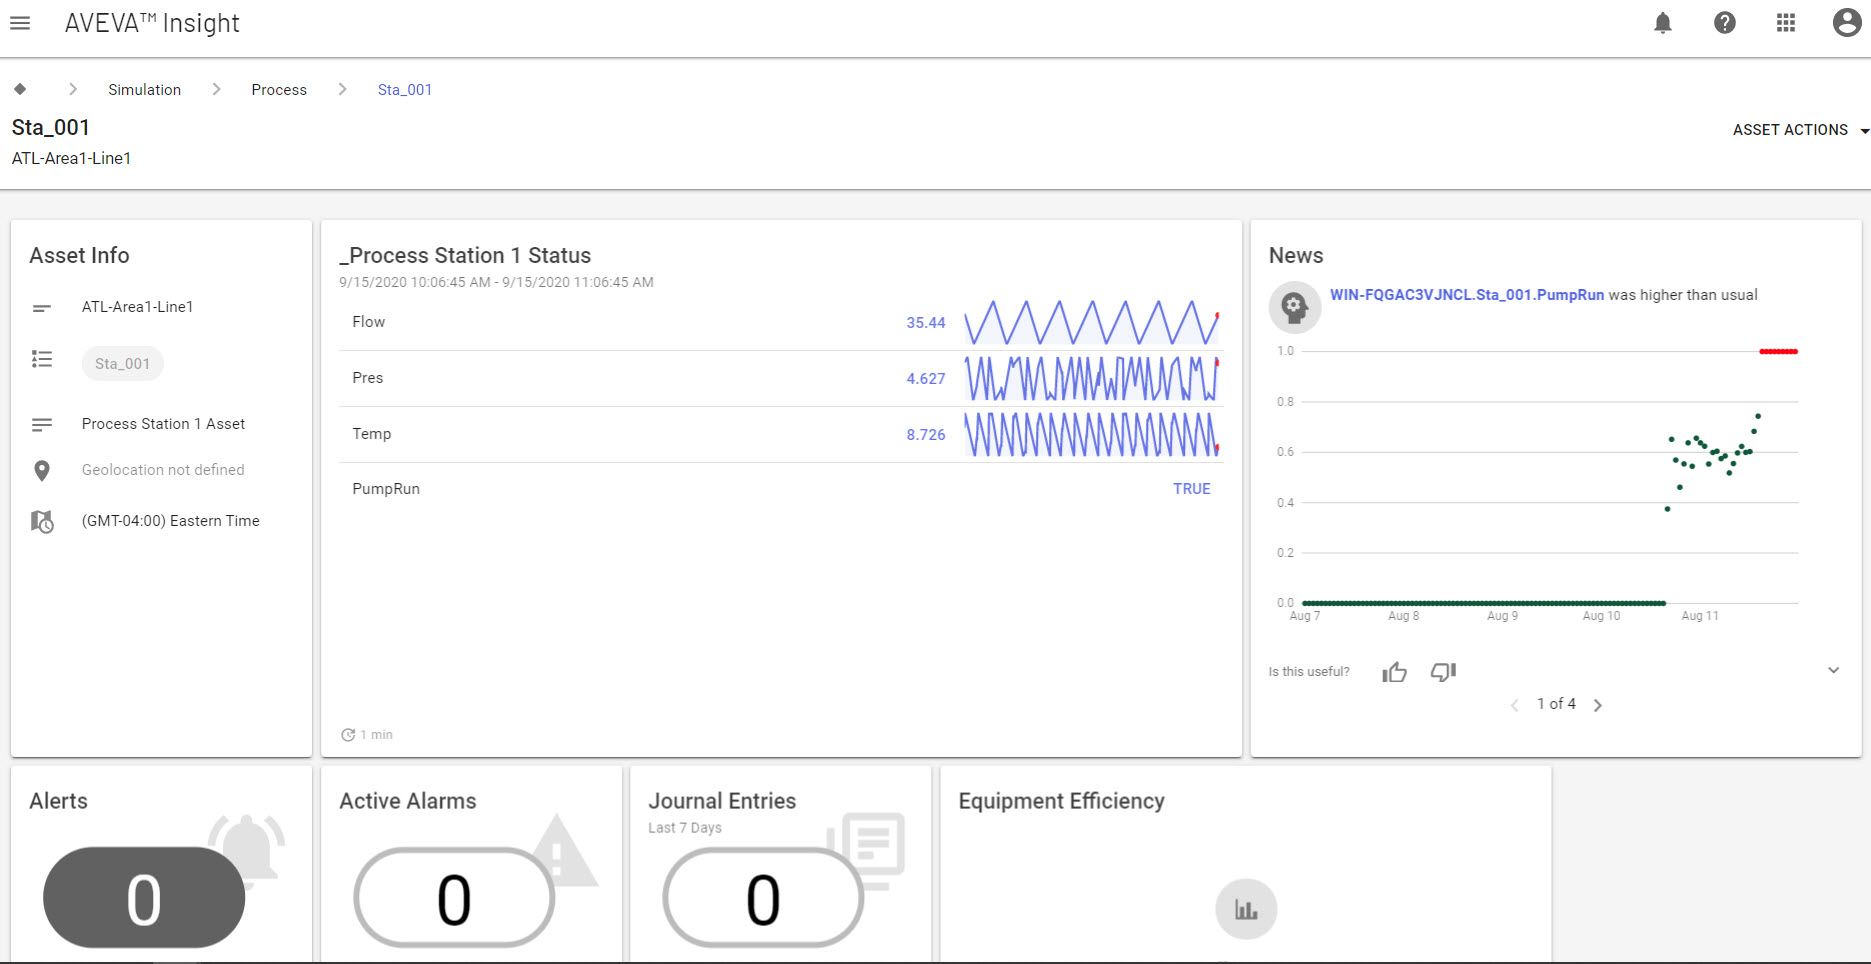
How to get Started
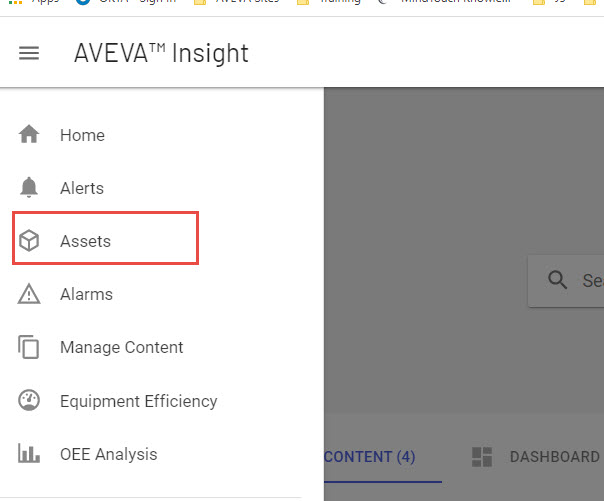
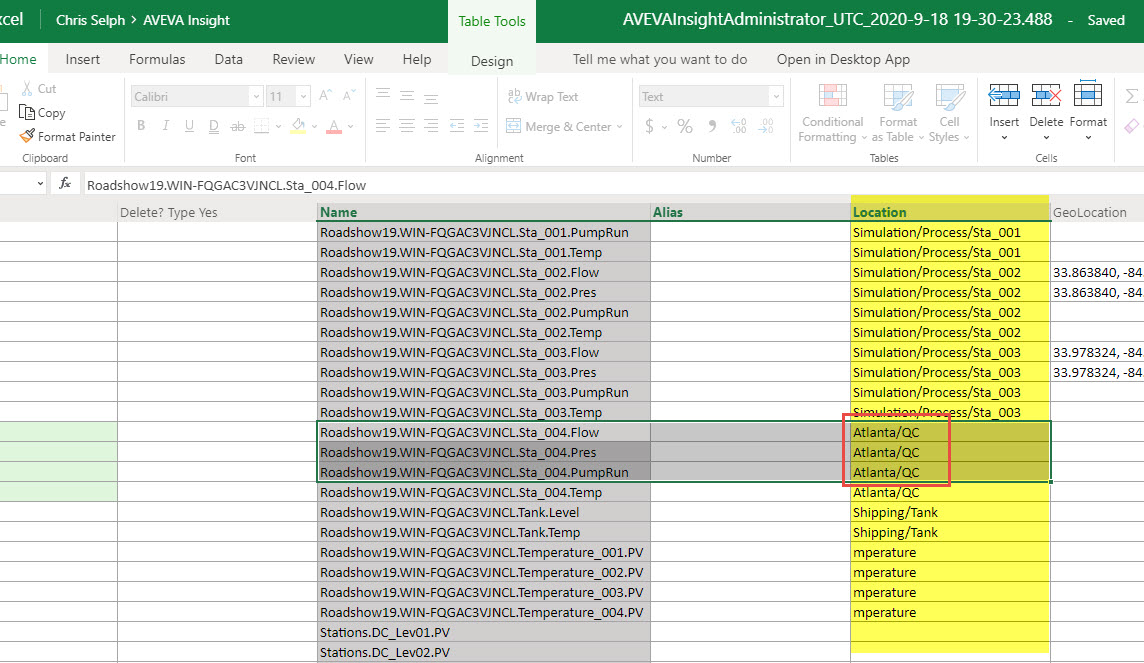
You need to create an asset hierarchy via the Insight Asset Manager or via the Tag Dictionary editor in Excel.
Insight Asset Manager
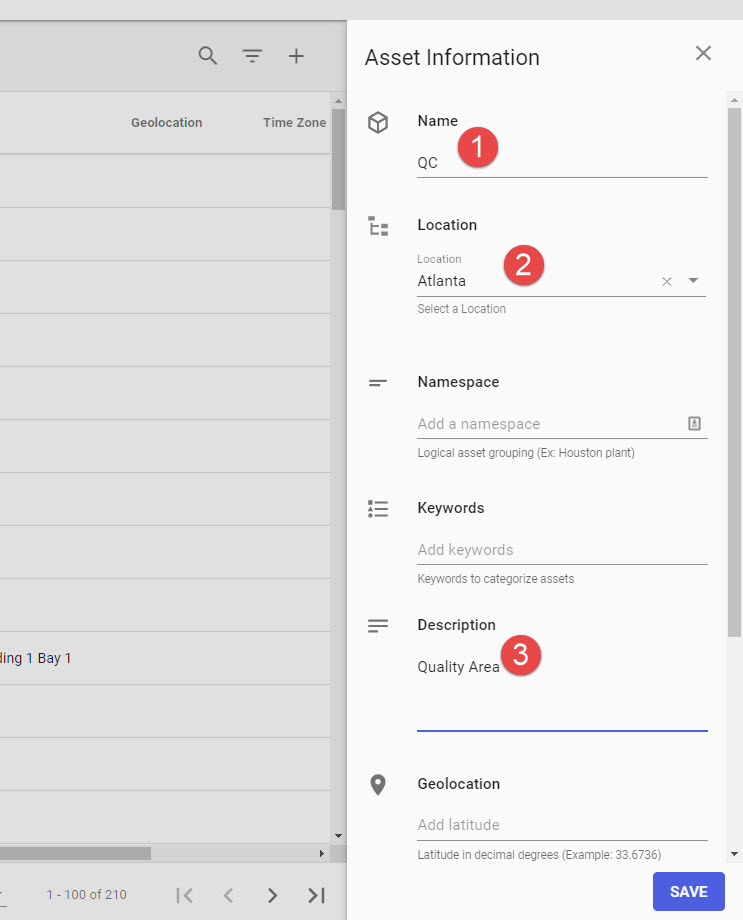
Create a new Asset or level in an existing Asset Hierarchy:
Providing at a minimum A Name, a location parent and a Description.
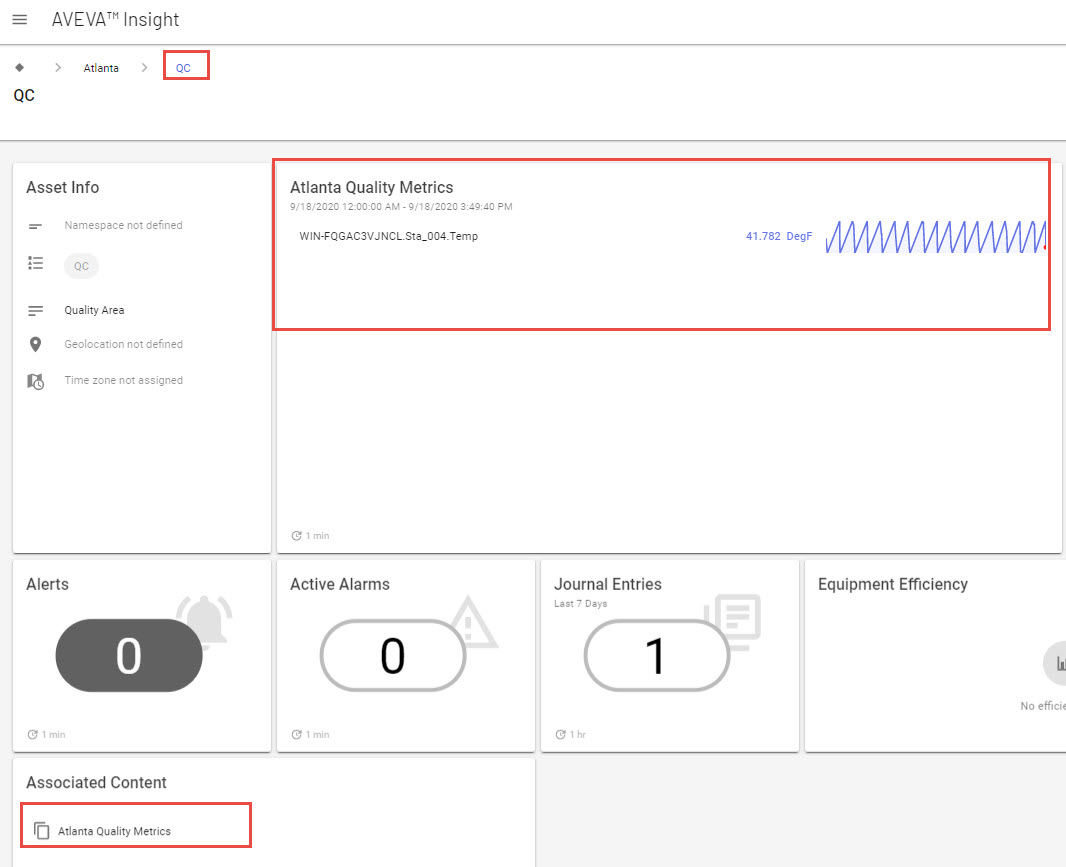
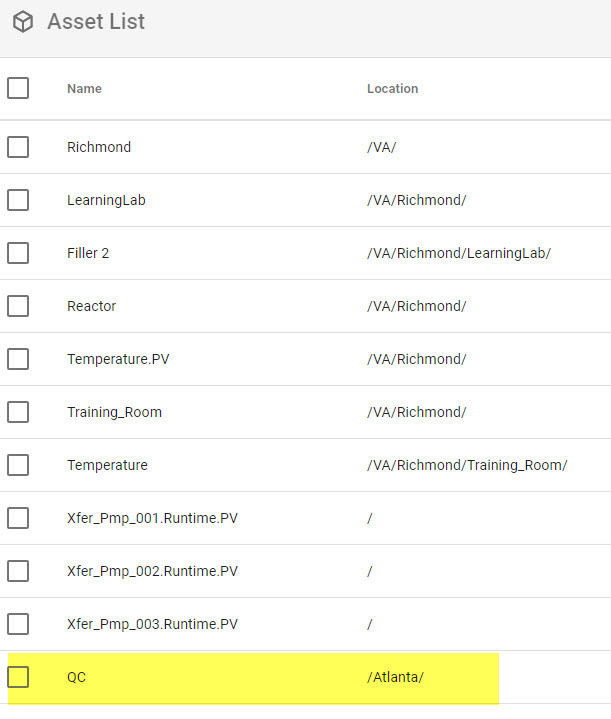
The QC area will be added to the Atlanta hierarchy:
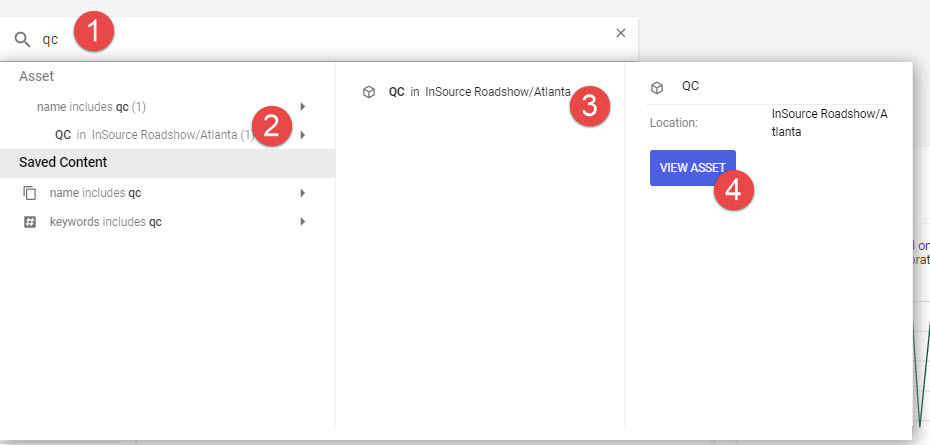
One way to find an asset in the hierarchy is via the search:
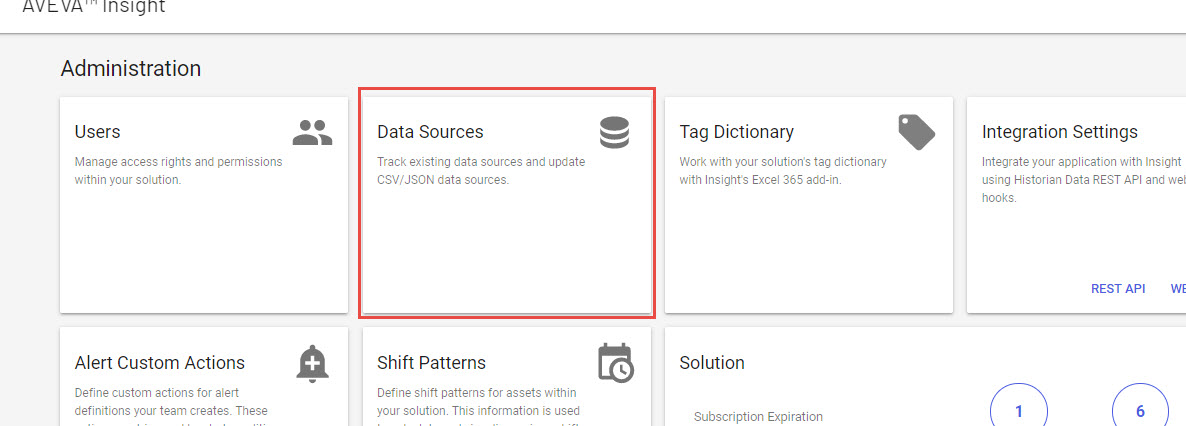
Tags must be added to a hierarchy to been seen in the Asset View. You add tags by editing the Administration > Tag
Content with these tags can now be saved to that level of the hierarchy.
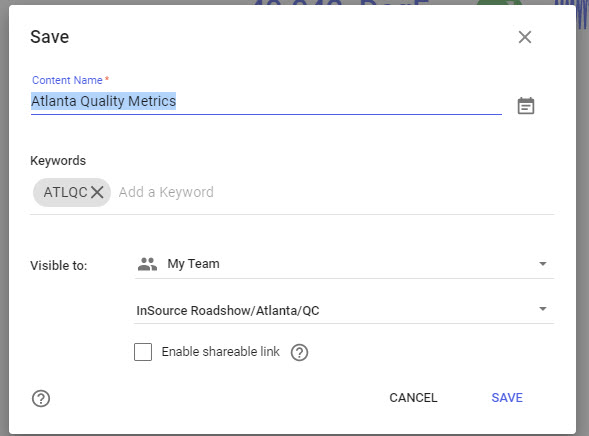
and seen in the Asset View: