TN HistClient106 Viewing Tag Statistics from Historian Client Trend
![]()
Description
When a trend is plotted on within Historian Client, it is possible to see the statistical information of the tags being displayed. This article from InSource walks through accessing this information.
- Author: Michael Walker
- Published: 05/26/2015
- Applies to: Wonderware Historian Client (all versions)
Details
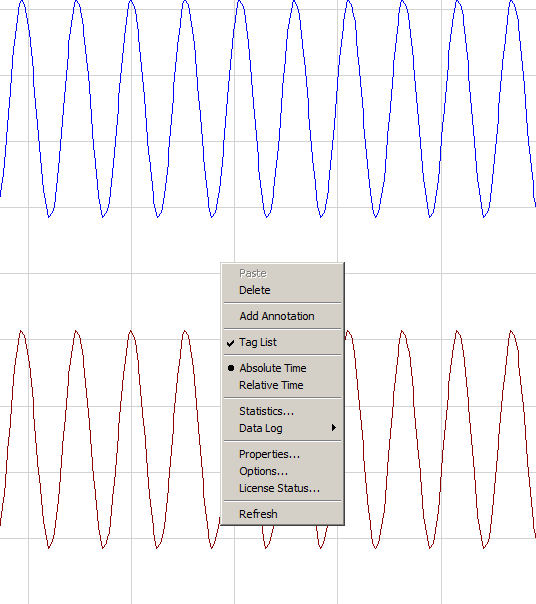
When a trend is plotted right click anywhere on the trend display. A menu will display as seen in the figure below.
Choose the option for Statistics. It will display the following information: Tag Type, Tag Name, Server, Number of Samples, Minimum Value, Time at Minimum Value, Maximum Value, Time at Maximum Value, Average, Standard Deviation, Range, Time span, Start and End Times of the Trend. The figure below displays this information.