TN DR118 Displaying Utilization in Dream Report
Description
This article from InSource shows how to report on utilization from Dream Report.
- Author: Rich Brooks
- Published: 1/2/2020
- Applies to: Dream Report v4.83 and higher
Details
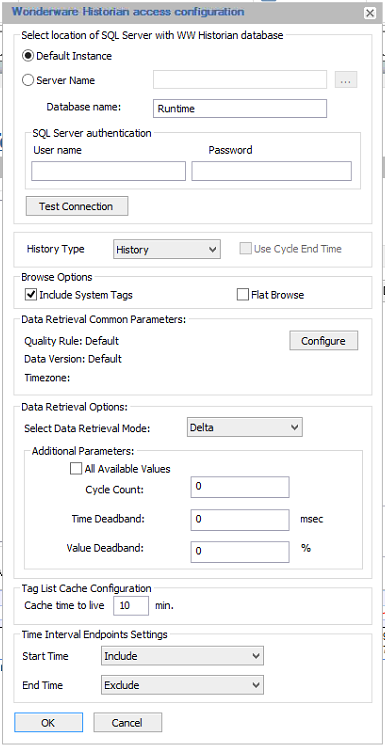
You may display downtime or uptime using an analog tag stored in the Wonderware Historian. Start by setting up a driver for the Historian using the delta retrieval mode.
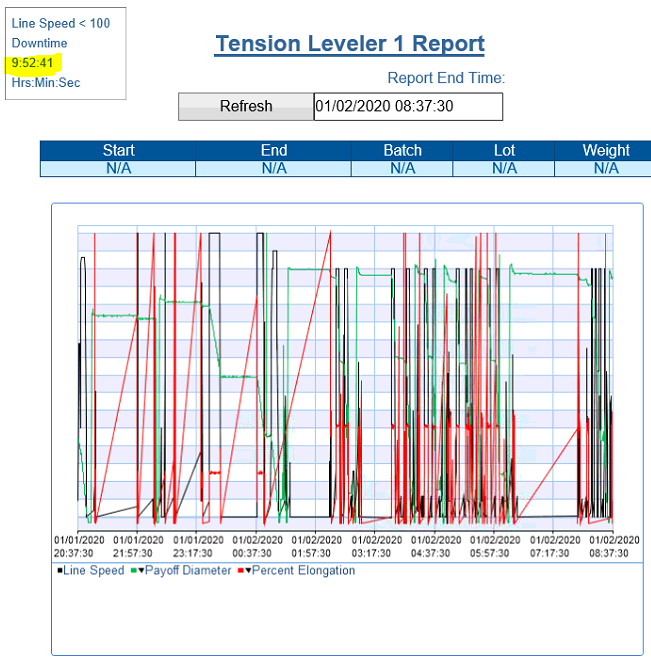
Next, add a Single Data Object to the report utilization. An analog tag may be used to calculate downtime. The following example uses a line speed tag. A speed of 100 or less is considered downtime.
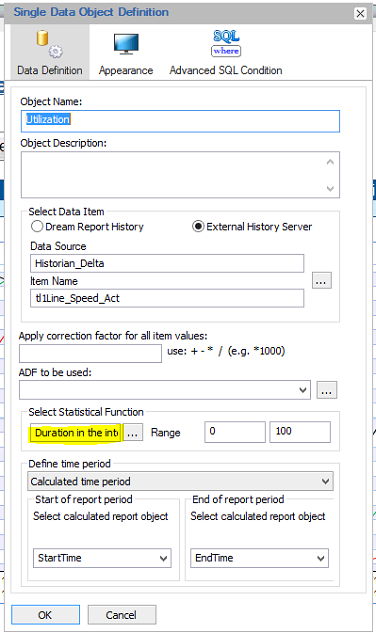
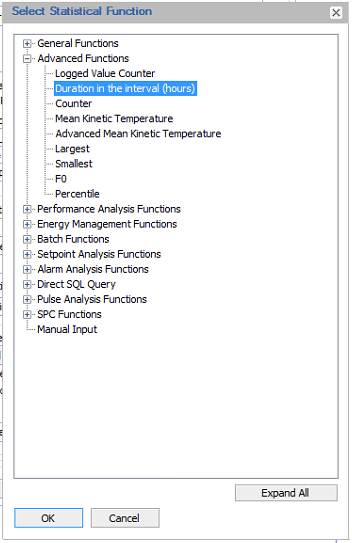
Select the Duration in the interval (hours) for the Select Statistical Function. This is found under the Advanced Functions.
The report may be tied to a start and end time defined in the report. Utilization is calculated based on this time period. The following example report used a 12 hour period to show over nine hours and fifty-two minutes of downtime. This is not obvious from the trend.