TN AG118 Using Dashboard Graphics to Monitor SetPoint Variation
![]()
Description
This article from InSource shows how to use Situational Awareness Dashboard graphics to monitor and visualize differences between setpoints and process variables in Wonderware's InTouch HMI.
- Author: Chris Selph
- Published: 2/26/2017
- Applies to: Application Server 2014 and InTouch 2014 R2 and Above (using Modern Application Type)
Details
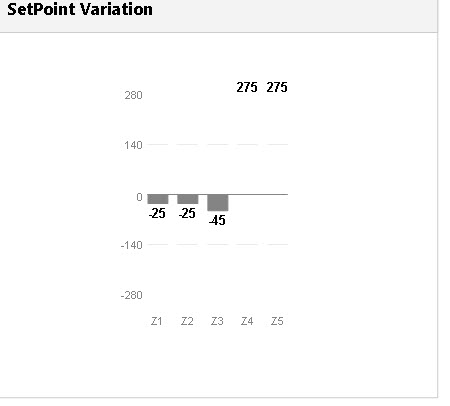
For this use case, let's say you have several control loops and you want to be able to easily visualize the variation between setpoint values and their respective process variable values as seen below.
There are several ways to acomplish this so let's look at one easy way using the Situational Awareness "Deviation Chart" which can be used in System Platform or in Classic InTouch (when working in a Modern application type.)
Steps (essentially the same regardless of the development environments including Stand Alone graphics in SP or Modern Apps and object embedded symbol in SP/AppServer)
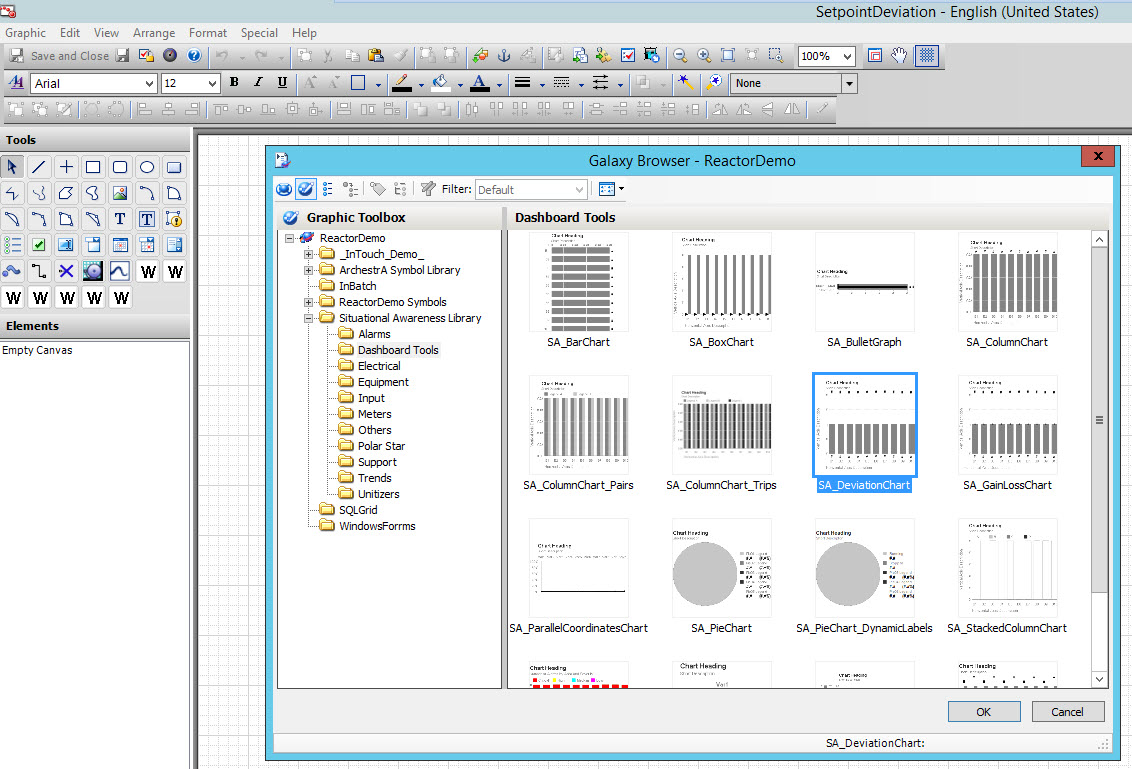
Create a new Archestra Graphic
Embed a Deviation Chart from the SA Library > Dashboard Tools
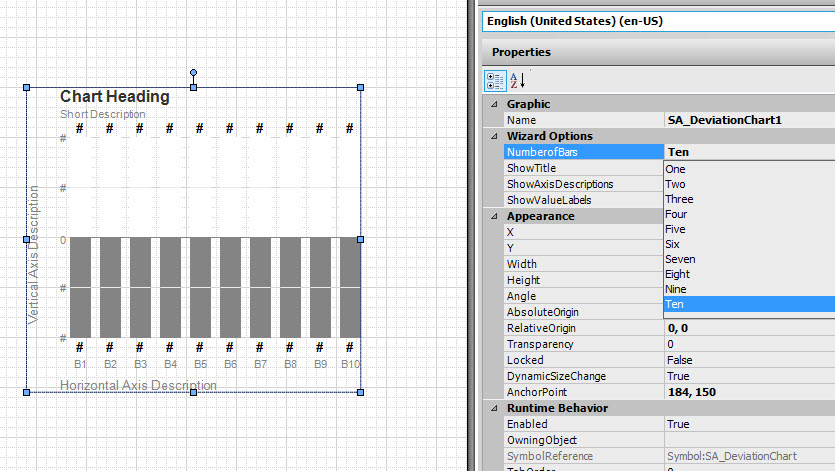
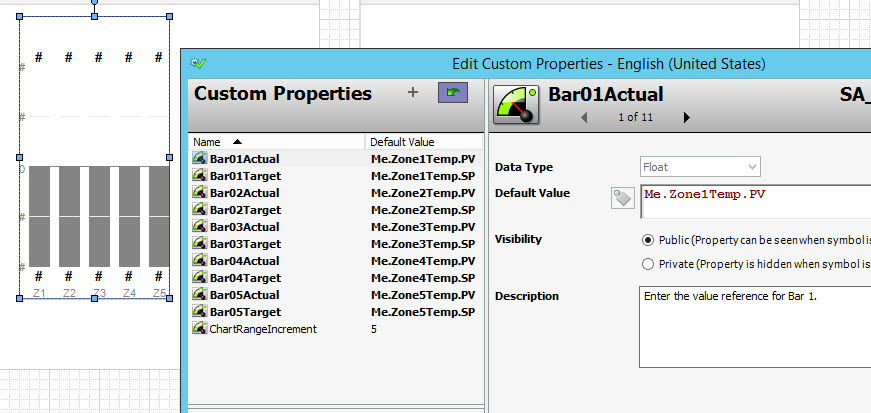
Choose the number of attributes or tags you are monitoring:
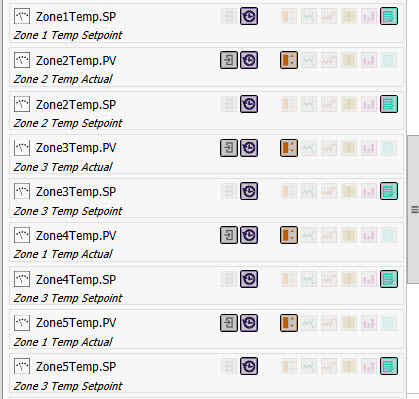
Edit the Deviation Chart's Custom Properties and assign the SetPoint/Process Variable Pairs to each bar.
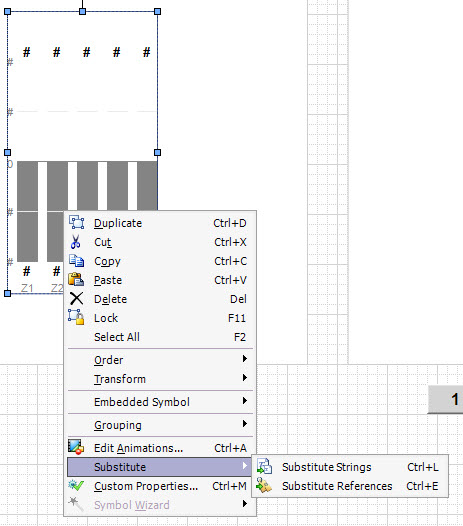
Change the Bar Labels as desired using Substitute Strings function:
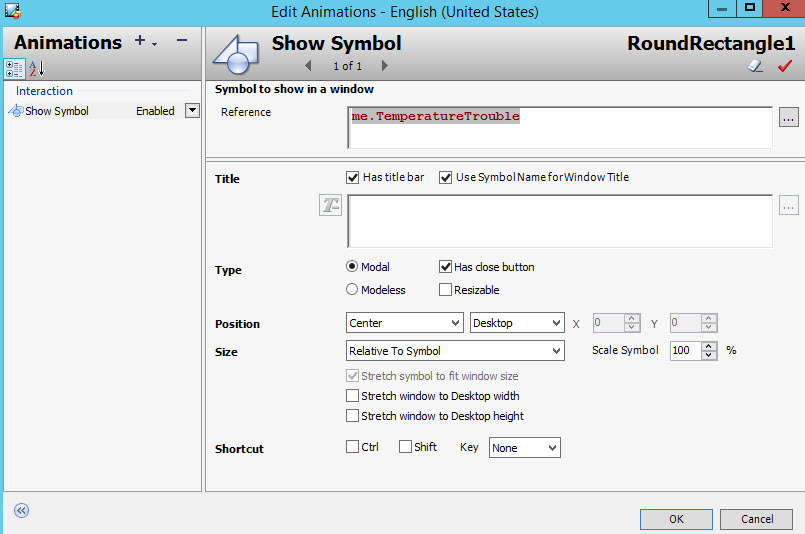
Make the symbol visible in Runtime by either dropping the Symbol on an InTouch Window or doing a ShowSymbol animation link on another object.
In Runtime, you can see the bars graphically representing the difference in SP and PV and it gives you the numeric difference as well.