TN Hist221 Historian Connectivity Troubleshooting

Description
This article gives a brief introduction to where to look for a problem in the Wonderware Historian specific to it stopping to collect data. Often times we get the question "my trend chart shows no data" this seeks to answer a way to monitor that. There is also an event tag that gets created to send an email when 1 or more topic is disconnected.
- Author: Lewis Talley
- Published: 07/23/2015
- Applies to: Historian (any)
Details
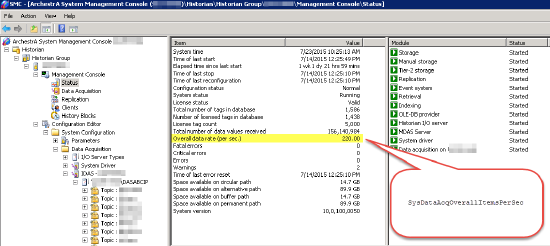
Open the SMC (Start --> All Programs --> Wonderware --> System Managment Console). Expand the Historian Group and the Server object and select status (as shown)
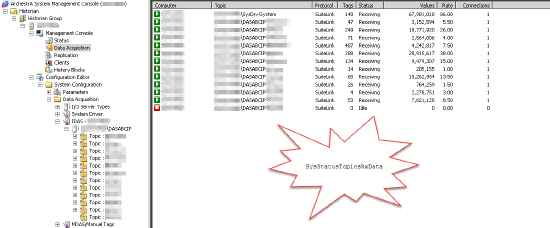
The system tag is highlighted that shows the overall rate at which the system is collecting data. There is other useful information displayed here also such as how long the system has been running for. You can also select the Data Acquisition object (as shown below) to get an idea of which topics are collecting (or not).
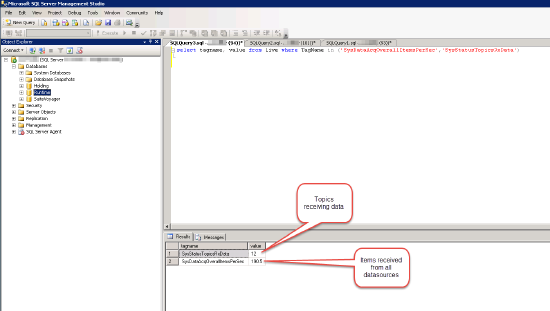
In the case above we have 1 topic not collecting data. An alternative to the above to screen shots is to query the Historian Runtime database as shown below:
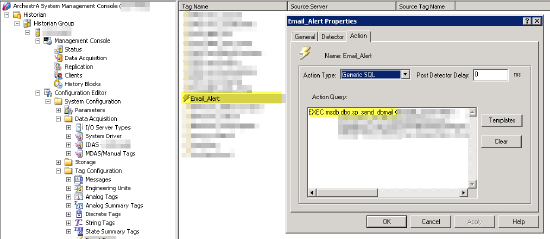
In the above example we want to create an alert when we stop collecting some data. I created and event tag with the following detector: Tags can be created by clicking on the configuration editor --> System configuration --> Tag configuration ---> event tags (then right click new).
Analog specific value with a time interval of 3,600,000 looking at the tag SysStatusTopicsRxData <= 11. This will fire an event when data is not being collected on any of the topics currently connected. The action chosen is Generic SQL (see below) and a email alert gets sent out when the condition is true.
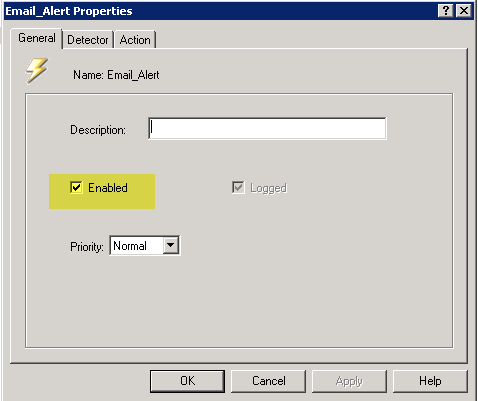
Note that you don't have to delete an event you can simply turn it off (as shown below)

